
Indicators
DASIG indicators for NinjaTrader 8
The same momentum lines the automated strategies read, on your own charts. Use them to follow what AutoEntry is doing, or to trade the signals yourself.
The suite
Three indicators, one way of reading the market
DASIG
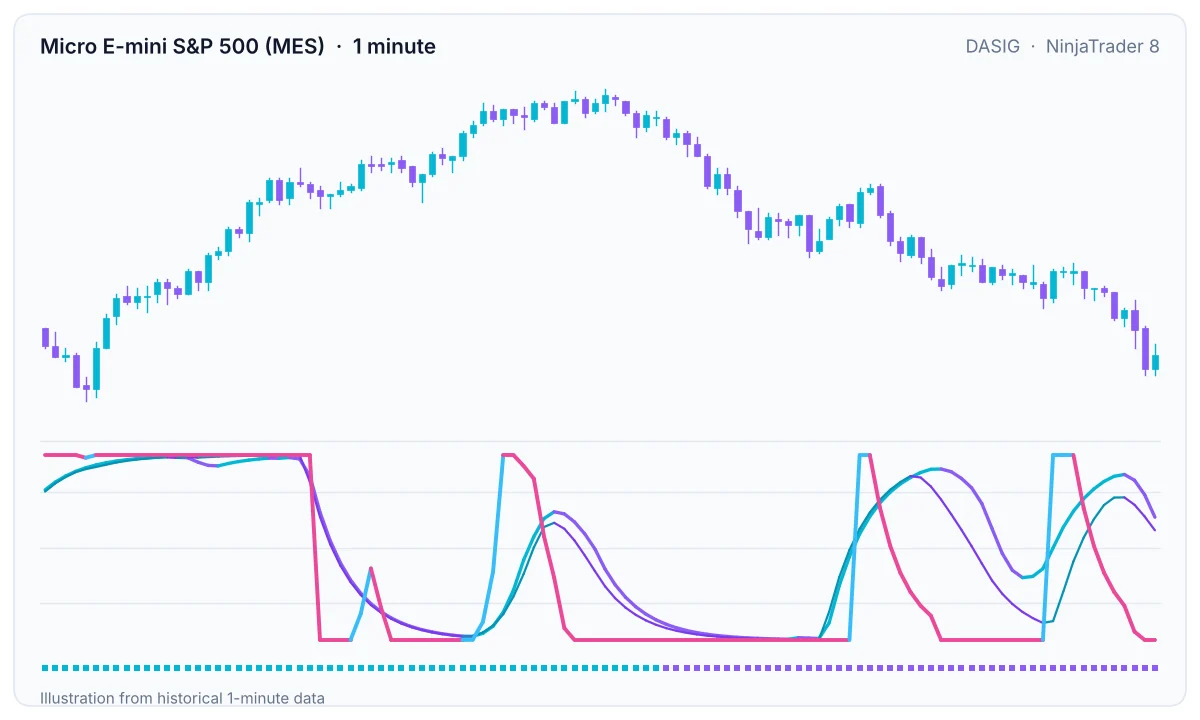
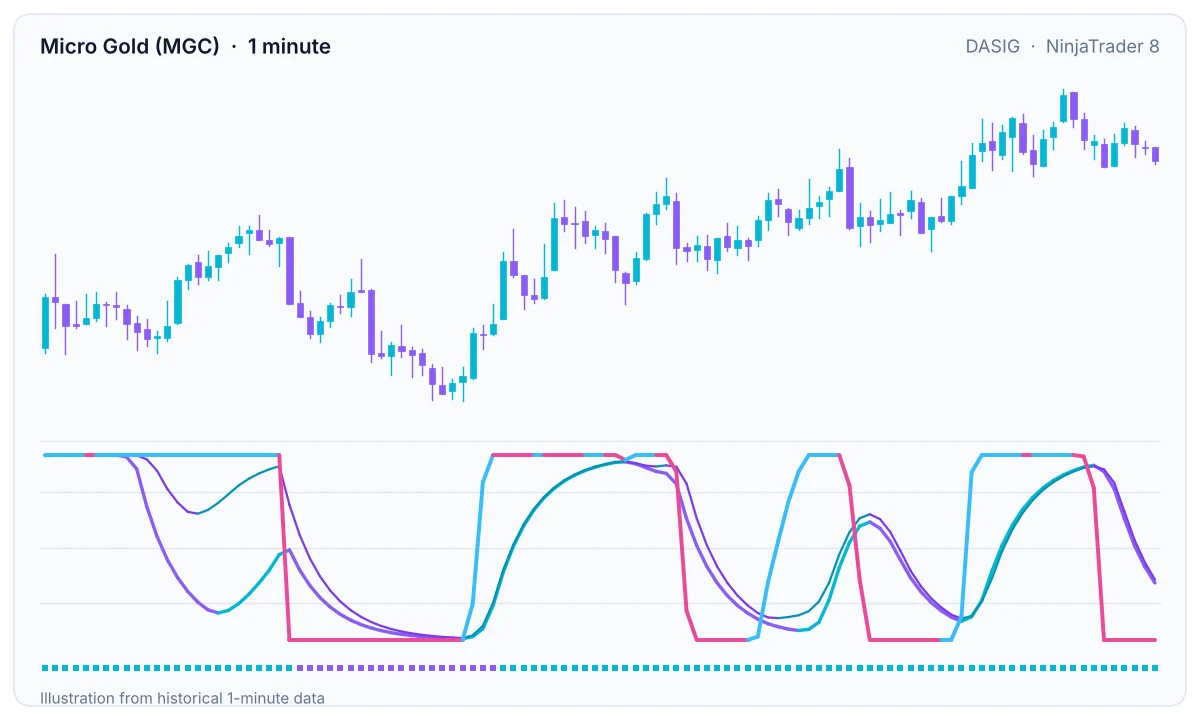
Momentum lines at several speeds in one panel, from the fast Vortex line to the slow and long-range lines, plus trend squares that show which side of the trend price is on.
- Rising lines in cyan, falling in purple
- Slow line in sky blue and pink
- Trend squares under the panel
CipherPoint
The momentum panel the Cipher strategy reads: fast, slow and long-range lines, the Ange190 line and the trend squares, with an optional Vortex line.
CipherSignals
Draws Venzi Buy and Venzi Sell arrows on the price chart when the Vortex line and Ange190 agree with the trend squares, one arrow per square change, on closed bars. The squares have the final say.
Reading DASIG
Fast, medium and slow, in agreement
A single momentum line flips constantly. DASIG stacks lines with different speeds so you can see when short-term and longer-term momentum agree — and when they don’t.
- Vortex line — the fastest read, first to turn
- Ange190 — confirms that the move has follow-through
- Long-range line and slow line — the bigger picture
- Trend squares — whether price is above or below its trend
Each AutoEntry strategy uses its own combination. All5s requires all five.
Indicator questions
Are the indicators included with the subscription?
Yes. DASIG, CipherPoint and CipherSignals are part of the Venzitech AutoEntry subscription, alongside the automated strategies.
Do the indicators repaint?
The DASIG lines are calculated from closed bars. A line’s value on the bar that is still forming can change until that bar closes, which is true of any indicator calculated on bar close.
Can I use the indicators for manual trading?
Yes. Many members trade the same signals by hand, or use them to understand what the strategies are doing. The course covers manual entries.
What do the colours mean?
Cyan means a line is rising (bullish) and purple means it is falling (bearish). The slow line uses sky blue for rising and pink for falling, so it stands out. Trend squares are cyan above the trend and purple below it.
Which markets and timeframes do they work on?
They work on any NinjaTrader 8 chart. The strategies use 1-minute charts of MNQ, MES, MGC and MCL.
Futures trading involves substantial risk of loss. Automated strategies can and do lose, and past performance is not indicative of future results. Read the risk disclosure.
Put the system to work on your account
Strategies, indicators, ATM templates, training and the live community for $350 a month. Cancel anytime.